Unit 7: one-variable statistics |
Length: Two weeks
|
Learning Goals:
Week 1: Terminology & Representations/Graphing
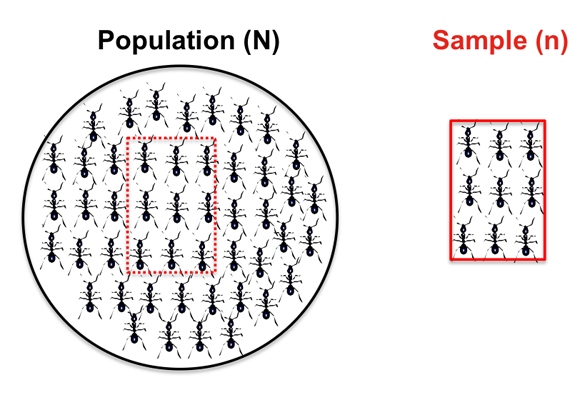
1. I can identify and explain the distinction between population and sample in situations involving one-variable data collection.
2. I can describe the characteristics of a good sample and why sampling is necessary.
3. I can describe and compare sampling techniques (i.e. cluster, systematic, convenience, etc.)
4. I can collect one variable data from primary and secondary sources.
5. I can organize and store the data I collect.
6. I can display one variable data in appropriate graphical forms.
7. I can identify and describe properties associated with common distributions of data.
Definitions: population, sample, census, simple random sample, systematic sample, stratified sample, cluster sample, judgment sample, voluntary sample, convenience sample, bias, primary source, secondary source, bar graph, histogram, pie chart (circle graph), categorical data, continuous data, discrete data, Normal Distribution, Bimodal Distribution
Week 2: Analysing the Data - Measures of Central Tendancy & Measures of Spread
1. I can calculate and interpret measures of central tendancy (Mean, Median, Mode)
2. I can calculate the range of a set of data.
3. I can identify and calculate the quartiles and interquartile range of a set of one-variable data.
4. I can use the range and the standard deviation (Measures of Spread) to interpret and compare different sets of data.
Definitions: Mean, Median, Mode, Range, Quartiles, Interquartile Range, Standard Deviation, Normal Distribution, Bimodal Distribution
Daily Schedule and Worksheets:
|
Week: November 9th-13th
Monday: Sampling Techniques Tuesday: Collect and Analyze Data Wednesday: Display Data Thursday: Review & Week 9 Test Friday: PD Day |
Week: November 16th-20th
Monday: Common Distributions Tuesday: Measures of Central Tendancy Wednesday: Measures of Spread Thursday: Assignment Friday: Review & Week 10 Test |
